Where you live changes your EV insurance bill more than almost any other single factor besides the vehicle itself. The same Tesla Model Y can cost twice as much to insure in one state as it does in another, and the gap between EV and gas car pricing swings just as wildly. This guide breaks down the regional patterns behind those differences and shows you where your state likely falls, so you know what to expect before you get a quote.
Key takeaways:
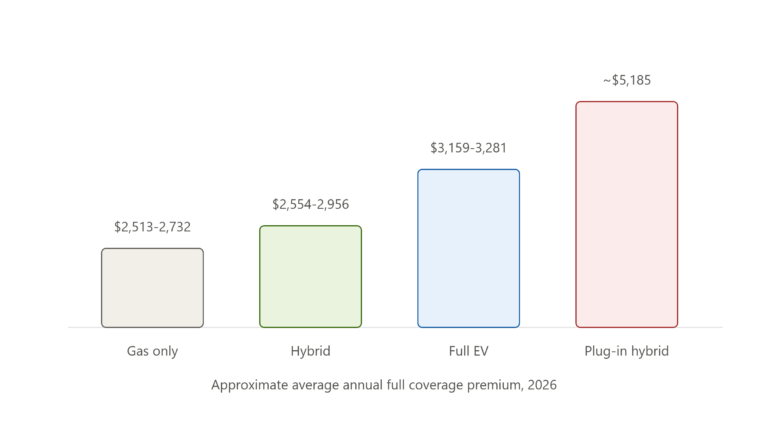
- Nationally, full coverage on an EV averages somewhere between $3,159 and $4,058 a year in 2026, but state averages range from under $2,000 to well over $5,000.
- The states with the highest overall auto insurance costs, Louisiana, Florida, Michigan, and Nevada among them, tend to stack an EV surcharge on top of already elevated baseline rates.
- Rural, low-density states like Vermont, Maine, and Wyoming consistently post the lowest premiums for any vehicle type, EV included.
- The percentage gap between EV and gas insurance varies even more than the dollar amount, from under 5% in some states to nearly 100% in others.
Why state matters so much for EV insurance
Auto insurance in the United States is regulated at the state level, which means every state sets its own minimum coverage requirements, and insurers price risk based on factors that are almost entirely local: accident frequency, weather exposure, litigation environment, uninsured driver rates, and the density of certified repair shops in the area. None of that is EV-specific, but it hits EV owners harder because EVs are already more expensive to repair and replace than gas cars. A state with an expensive baseline for insurance in general will usually apply that same expensive baseline to EVs, then add the EV-specific repair and battery risk on top.
That’s the core reason a state-by-state view matters more for EVs than it does for gas cars: you’re not just looking at one variable, you’re looking at how two separate cost pressures, general state-level risk and EV-specific repair complexity, compound on top of each other.
The states where EVs cost the most
A few consistent patterns show up across multiple 2026 insurance analyses.
High baseline states with EV surcharges stacked on top:
- Louisiana consistently ranks among the most expensive states for auto insurance of any kind, driven by a high accident rate, frequent severe weather, and a litigation environment that tends to push claim payouts higher. EV owners here face both the state’s already elevated baseline and the added EV repair premium.
- Florida carries similar pressures: heavy traffic congestion, a high rate of uninsured drivers, and significant hurricane and flood exposure, all of which drive general insurance costs up before EV-specific factors are even considered.
- Nevada has the highest overall car insurance rates in the country, largely tied to traffic congestion in the Las Vegas and Reno metro areas, and that baseline carries through to EV pricing as well.
- Michigan leads the nation in average annual auto insurance cost overall, a legacy of the state’s no-fault insurance system and its unique medical coverage requirements, which apply to EVs and gas cars alike.
States with the widest EV-specific gap (EV cost versus gas cost, not just the dollar amount):
- Arkansas and Pennsylvania currently show the largest relative gap between EV and gas insurance costs in the country, with EVs running close to double what a comparable gas car costs in each state. In Arkansas, EV owners pay roughly $4,817 a year on average against about $2,415 for gas car owners. Pennsylvania shows an almost identical pattern, EVs around $4,598 against $2,314 for gas vehicles.
- Idaho and Iowa both show gaps above 85%, despite neither state being particularly expensive for insurance overall, largely because EV adoption there has been slower, meaning fewer certified repair shops and less competitive EV-specific pricing among insurers.
- Delaware combines both problems at once: already elevated baseline insurance costs plus a wide EV-to-gas gap, pushing EV premiums there to some of the highest dollar figures in the country, averaging around $5,840 a year.
The single most expensive market:
Washington, D.C. currently holds the title for the highest average EV premium of any market in the country, with EV drivers there paying roughly $6,394 a year on average, a figure driven by dense urban traffic, high vehicle values, and elevated repair costs typical of major metro areas.
The states where EVs cost the least
The pattern reverses cleanly in low-density, rural states, which consistently show the cheapest insurance for any vehicle type.
Vermont, Maine, and Wyoming post the lowest overall full-coverage auto insurance rates in the country, each averaging under $135 a month for a standard gas vehicle, more than a third cheaper than the national average. While EV-specific figures for these states run somewhat higher than their gas-car baseline, the same low-density, low-accident-frequency advantage that keeps their general rates low also tends to soften the EV surcharge relative to what you’d see in a high-cost state.
New Hampshire shows a similar pattern with one useful data point: it currently has the smallest EV-to-gas price gap of any state measured, at roughly $84 a month difference, meaning EV owners there face one of the most modest surcharges in the country relative to their gas-driving neighbors.
Beyond these standout states, a broader regional pattern holds: much of the Great Plains and Mountain West sees lower claim severity and less catastrophic weather risk than the coasts or the Gulf region, and that advantage extends to EV owners even though it wasn’t designed with EVs in mind.
A rough regional map
Putting the state-specific data points together with general auto insurance baseline patterns, a few broad regional groupings emerge:
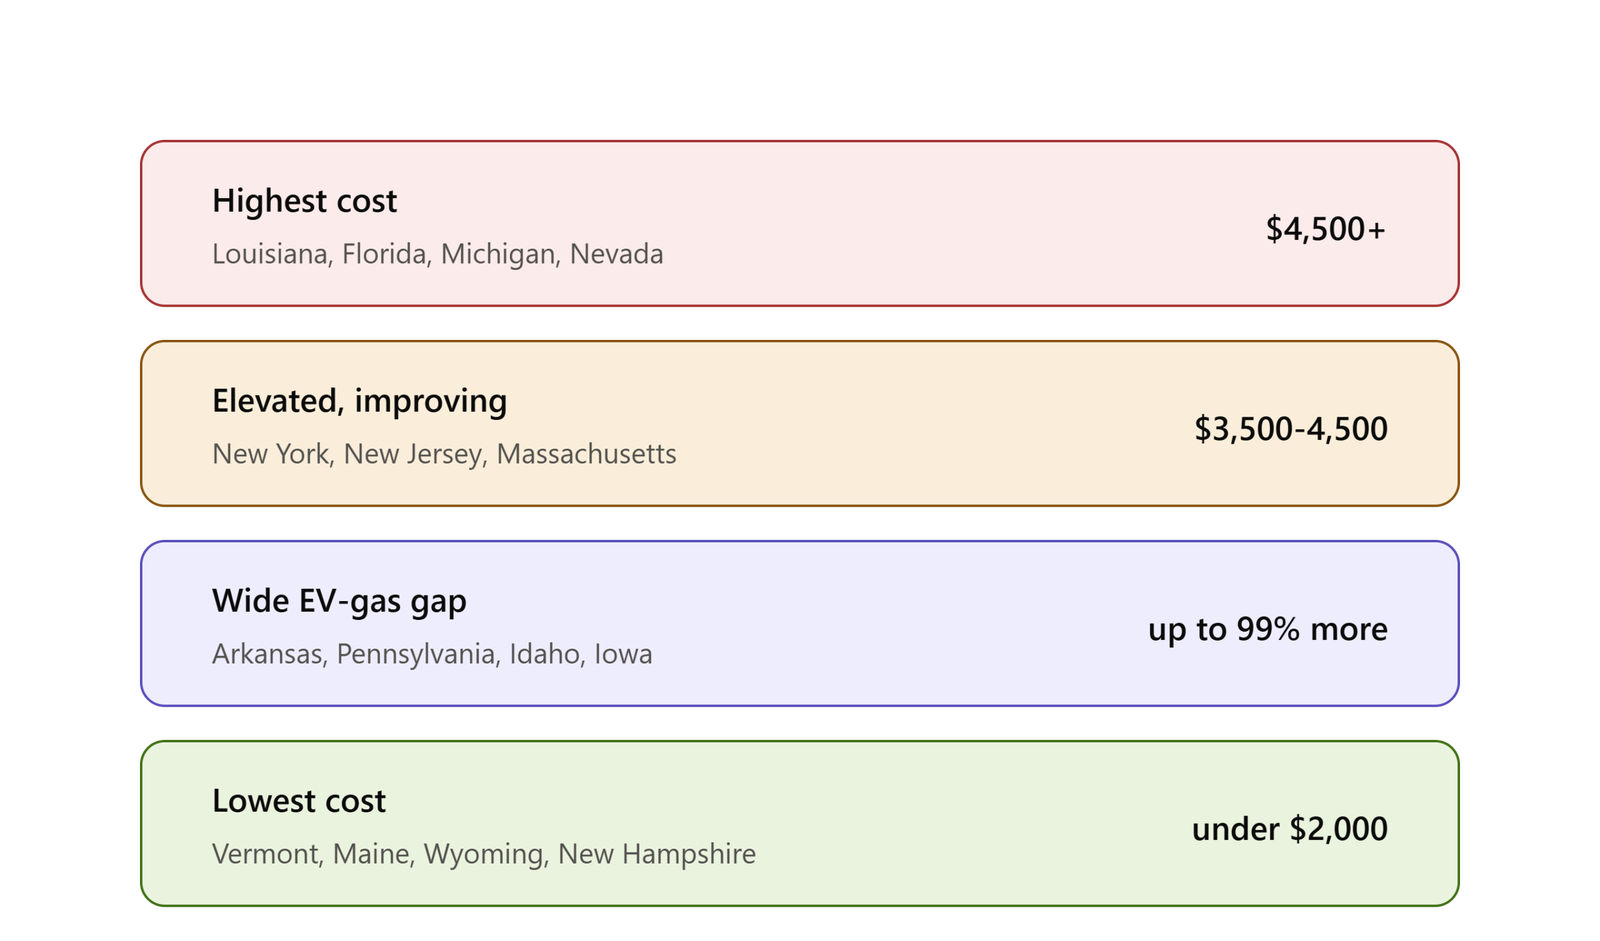
Highest cost region: The Gulf Coast and Southeast (Louisiana, Florida) combined with the industrial Midwest (Michigan) and the desert Southwest urban centers (Nevada), driven by a mix of weather risk, litigation environment, traffic density, and no-fault insurance structures.
Elevated but improving: The urban Northeast (New York, New Jersey, Massachusetts, Connecticut, Rhode Island), where dense metro areas drive up both baseline and EV-specific costs, though Massachusetts in particular is seeing its EV repair network mature, which should gradually narrow the gap over the next few years.
Wide EV-specific gap despite moderate baseline: States with slower EV adoption histories, including Arkansas, Pennsylvania, Idaho, and Iowa, where the issue isn’t necessarily that insurance is expensive overall, but that EV-specific infrastructure and pricing competition haven’t caught up yet.
Lowest cost region: Rural New England and the Mountain West (Vermont, Maine, New Hampshire, Wyoming), where low population density and lower accident frequency keep both gas and EV premiums well below the national average.
Why the same car costs so differently in two states
It’s worth being specific about what’s actually driving these gaps, because it isn’t random.
Repair shop density. States where EV adoption arrived earlier and in higher volume, largely concentrated on the coasts and in a handful of tech-forward metro areas, have had more time to build out certified EV repair capacity. States where EV adoption is newer or slower often have fewer certified shops, which means longer repair timelines and less price competition, both of which insurers price into every policy in that state.
Litigation and claims environment. States with higher rates of litigation around auto claims, or with no-fault insurance systems that require broader mandatory coverage, tend to see higher payouts across the board, and that baseline carries through to EVs.
Weather and catastrophe exposure. Hurricane, flood, and severe storm risk drives up comprehensive coverage costs specifically, and EVs, with their higher replacement value, feel that pressure more acutely than a comparable gas car would.
Theft and vehicle crime rates. States and metro areas with higher vehicle theft statistics see that risk reflected directly in comprehensive coverage pricing, and a stolen or totaled EV is a significantly larger payout than a stolen gas car of similar age.
Local EV market maturity. Somewhat counterintuitively, states with more EVs on the road often see better pricing, not worse, because insurers have more data to price risk accurately and more competition among carriers actively writing EV policies. States where EVs are still relatively rare sometimes see wider, less competitive pricing simply because insurers haven’t built out a confident risk model for that market yet.
How to find your actual number, not just the state average
Everything above describes patterns and averages, not your specific premium. Your actual quote depends on your exact ZIP code (which can vary significantly even within the same state), your driving record, your age, your credit-based insurance score where applicable, the specific EV model and trim you drive, and which insurer you’re comparing.
A few practical steps:
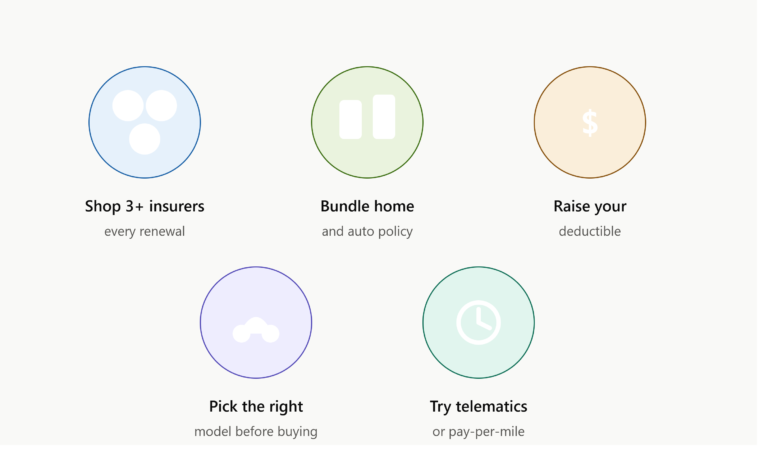
- Get quotes from at least three insurers, since carriers price EV risk differently from one another, sometimes significantly, even within the same state and for the same vehicle.
- Check your metro area specifically, not just your state. A driver in a dense urban ZIP code within a generally moderate state can still face rates well above that state’s overall average, and the reverse is also true for rural ZIP codes within otherwise expensive states.
- Ask specifically about EV discounts your state or insurer may offer. Some states and carriers offer green-vehicle or usage-based discounts that aren’t obvious from headline rate comparisons.
- Factor the insurance gap into your purchase decision alongside fuel savings. If you live in a state with a wide EV-to-gas insurance gap, the fuel and maintenance savings from going electric may take longer to offset the higher premium than they would in a state with a narrower gap.
The bottom line
State matters enormously for EV insurance, arguably more than for any other major cost factor in EV ownership. The gap between the cheapest and most expensive states can exceed $4,000 a year for an identical vehicle, and the percentage difference between EV and gas insurance in the same state can range from barely noticeable to nearly double. Before you assume a national average applies to your situation, check where your specific state and metro area fall in these patterns, and get an actual quote rather than relying on any general figure, including the ones in this article.
This article is for informational purposes only and does not constitute financial or insurance advice. Insurance rates vary by insurer, individual driving history, ZIP code, and vehicle, and change frequently. Always get a personalized quote before making a purchasing decision.