There’s no single public formula that spits out your exact EV insurance premium, every insurer guards its own pricing model closely, and none of them calculate risk identically. But you don’t need their exact formula to get a genuinely useful estimate. Insurers all draw from the same basic pool of rating factors, and once you understand how each one moves the number, you can build a realistic estimate of your own premium before you ever request a formal quote. This guide walks through exactly how to do that, factor by factor, with worked examples so you can see the math in action.
Key takeaways:
- Your premium starts from a base rate tied to your state and vehicle, then gets adjusted up or down by a series of individual rating factors layered on top.
- The biggest single factors are typically your vehicle model, your age, your driving record, and your location, in roughly that order of impact for most EV owners.
- A rough estimate built from these factors will usually land within a reasonable range of an actual quote, useful for budgeting, even though it won’t be exact.
- The only way to get a truly precise number is a real quote from an actual insurer, since proprietary algorithms and state-specific filings account for details a manual estimate can’t capture.
How insurance pricing actually works, in plain terms
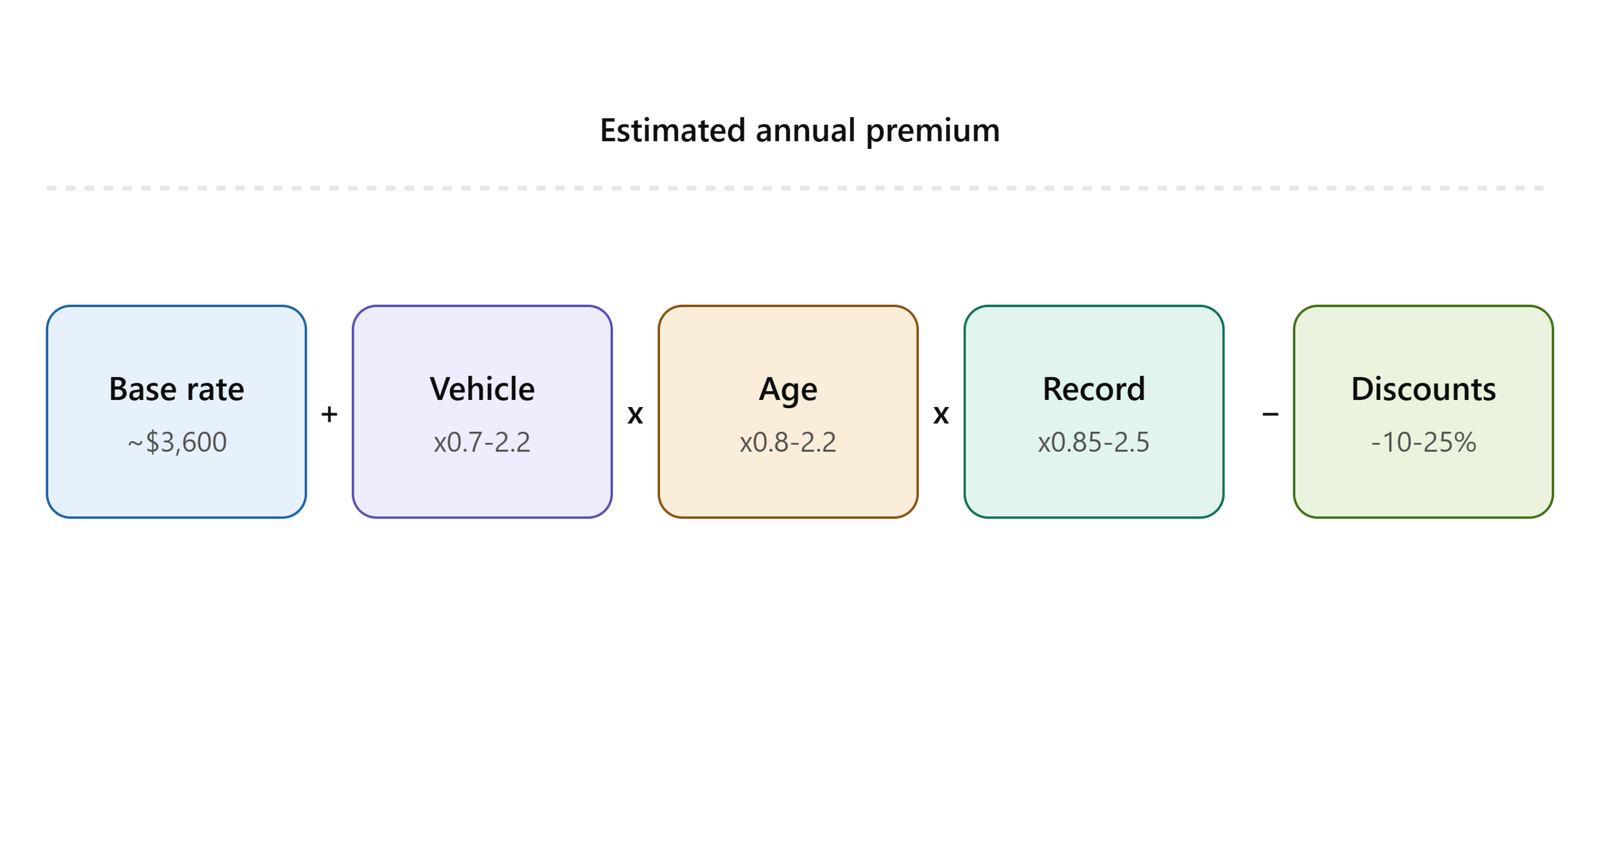
Every insurer starts with a base rate, essentially what a «typical» policy costs in your state for a standard vehicle and driver profile. From there, the company applies a series of multipliers and adjustments specific to you: your age, your vehicle, your driving record, your location, and several other factors. Each of those adjustments either raises or lowers the base rate, and the final number is your premium.
The industry-standard weighting, while it varies by company and state, generally follows a rough hierarchy. Driving record tends to carry the single largest weight of any individual factor. Non-driving factors, including your credit-based insurance score and where you live, collectively account for a substantial portion of the total picture, often comparable to or exceeding the weight of the vehicle itself in many states. Vehicle type and specific model sit as a major factor on their own, and for EVs specifically, this factor carries outsized weight compared to gas cars because of the repair-cost patterns covered throughout this site.
Understanding this structure is the key to building your own estimate: you’re not guessing a random number, you’re applying a series of known directional adjustments to a public baseline.
Step 1: Start with your state’s baseline
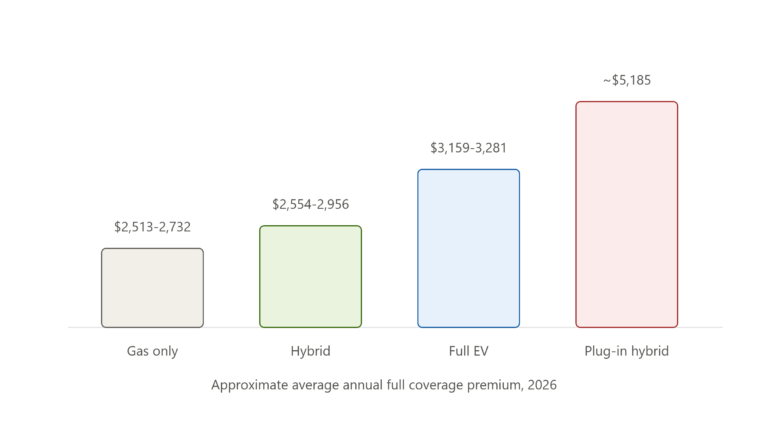
Begin with the national average for full-coverage EV insurance in 2026, which lands somewhere between roughly $3,159 and $4,058 a year depending on which dataset you reference, then adjust for your specific state using the patterns covered in our state-by-state cost guide.
- If you’re in a high-cost state (Louisiana, Florida, Michigan, Nevada, or similar), start by adjusting the national average upward by roughly 20% to 40%.
- If you’re in a moderate-cost state (most of the country), the national average is a reasonable starting point without major adjustment.
- If you’re in a low-cost state (Vermont, Maine, Wyoming, New Hampshire, or similar), adjust downward by roughly 20% to 35%.
This gives you your rough state-adjusted baseline before any personal factors are applied.
Step 2: Adjust for your specific vehicle
This is the single biggest lever in the entire estimate, and it’s where our cheapest and most expensive EV rankings become directly useful as inputs.
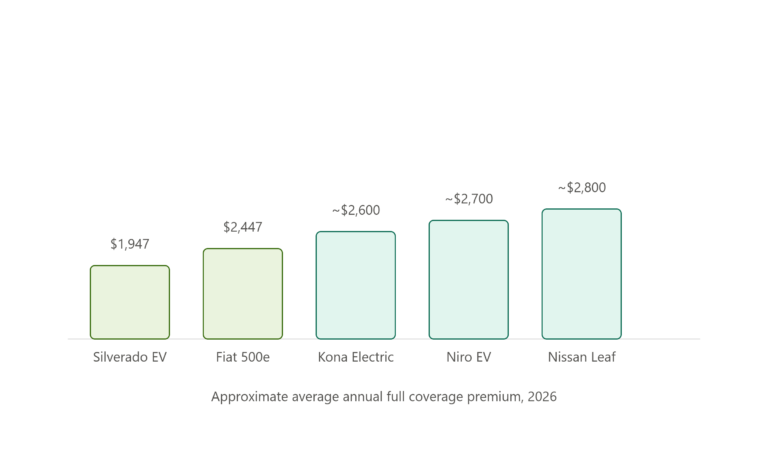
- Budget-friendly, mainstream EV (Fiat 500e, Chevrolet Silverado EV, Hyundai Kona Electric, Nissan Leaf, similar): apply a multiplier of roughly 0.7 to 0.85 against your state-adjusted baseline.
- Mid-range mainstream EV (Tesla Model 3, Ford Mustang Mach-E, Hyundai Ioniq 5, Chevrolet Equinox EV, similar): apply a multiplier close to 1.0, right around your baseline.
- Higher-end EV or EV-only brand (Tesla Model Y, Rivian R1T/R1S, GMC Hummer EV, similar): apply a multiplier of roughly 1.1 to 1.4.
- Luxury or performance EV (Tesla Model S/X, Audi e-tron lineup, BMW i7, Mercedes-AMG EQS, similar): apply a multiplier of roughly 1.6 to 2.2 or more.
Step 3: Adjust for your age
Using the age curve covered in our detailed breakdown of EV insurance by age:
- Under 25: apply a multiplier of roughly 1.5 to 2.2, with the high end applying to drivers under 21 specifically.
- 25 to 39: apply a multiplier of roughly 1.0 to 1.1.
- 40 to 60: apply a multiplier of roughly 0.8 to 0.95, generally the cheapest bracket.
- 60 to 70: apply a multiplier of roughly 0.9 to 1.0.
- Over 70: apply a multiplier of roughly 1.0 to 1.15.
Step 4: Adjust for your driving record
This is the factor with the single largest individual weight in most pricing models, so it deserves real attention:
- Completely clean record, 5-plus years: apply a multiplier of roughly 0.85 to 0.95.
- Clean record, under 5 years or one minor violation: apply a multiplier close to 1.0.
- One at-fault accident within the past 3 years: apply a multiplier of roughly 1.3 to 1.5.
- Multiple violations or accidents, or a DUI: apply a multiplier of roughly 1.6 to 2.5 or considerably more; drivers in this category should treat any manual estimate as far less reliable and prioritize getting real quotes instead.
Step 5: Adjust for coverage level and deductible
- Minimum/liability-only coverage: this typically runs 35% to 45% of what full coverage costs for the same profile.
- Full coverage, $500 deductible: treat this as your baseline (multiplier of 1.0).
- Full coverage, $1,000 deductible: apply a multiplier of roughly 0.9 to 0.95.
- Full coverage, $2,000 deductible: apply a multiplier of roughly 0.8 to 0.88.
Step 6: Apply your discount stack
After the multipliers above, subtract your applicable discounts as a percentage of the running total:
- Bundling home or renters insurance: subtract roughly 10% to 20%.
- Telematics or usage-based program (if you’re a genuinely safe, low-mileage driver): subtract roughly 10% to 25%.
- Defensive driving course completion: subtract roughly 5% to 10%.
- EV-specific or green vehicle discount, where offered: subtract roughly 5% to 10%.
These discounts often stack, though most insurers cap the total combined discount rather than letting every individual percentage compound endlessly.
A worked example: putting it all together
Let’s walk through an actual estimate for a hypothetical driver, so the process is concrete rather than abstract.
Profile: 32-year-old driver, clean driving record for 6 years, living in a moderate-cost state, driving a Tesla Model 3 (mid-range mainstream multiplier), full coverage with a $500 deductible, bundles with renters insurance, and enrolled in a telematics program.
- National baseline: $3,600 (roughly the midpoint of the national range)
- State adjustment: moderate-cost state, no adjustment, stays at $3,600
- Vehicle adjustment: mid-range mainstream multiplier of 1.0, stays at $3,600
- Age adjustment: 25-39 bracket, multiplier of 1.05, moves to $3,780
- Driving record adjustment: clean record 5+ years, multiplier of 0.9, moves to $3,402
- Coverage/deductible adjustment: full coverage, $500 deductible, no adjustment, stays at $3,402
- Discount stack: bundling (-15%) and telematics (-15%), combined roughly -25% after accounting for overlap caps, moves to approximately $2,550 estimated annual premium
A second profile for comparison: 22-year-old driver, clean record but limited history, living in a high-cost state, driving a Tesla Model Y, full coverage, no bundling or telematics yet.
- National baseline: $3,600
- State adjustment: high-cost state, +30%, moves to $4,680
- Vehicle adjustment: higher-end EV multiplier of 1.25, moves to $5,850
- Age adjustment: under-25 multiplier of 1.8, moves to approximately $10,530 estimated annual premium
That second number looks extreme, and it is, but it illustrates exactly why age and vehicle choice compound rather than simply adding together, echoing the pattern covered in our age-specific guide. It also shows why that same driver has real, concrete levers available: switching to a mainstream mid-range EV, adding telematics, and bundling policies could plausibly cut that estimate by 40% or more.
What a manual estimate can’t capture
Be honest with yourself about the limits of this method before you treat the output as a real number:
State-specific rate filings. Every insurer files specific rate tables with each state’s insurance regulator, and these filings capture hyperlocal patterns, down to the ZIP code or even the specific neighborhood, that a general estimate simply can’t replicate.
Credit-based insurance scores, where used, apply a level of individual precision that a rough multiplier can’t approximate, and this factor is banned entirely in a handful of states (California, Hawaii, and Massachusetts among them), which a generic estimate also can’t account for automatically.
Company-specific underwriting quirks. Some insurers specifically favor or penalize certain vehicle types, certain occupations, or certain telematics behaviors in ways that don’t show up in industry-wide averages.
Real-time market conditions. Rates shift throughout the year based on inflation in repair costs, reinsurance market pressure, and company-specific profitability targets, none of which a static estimate can track.
When to use this method, and when to just get a quote
This estimation approach is genuinely useful for a few specific situations:
- Budgeting before you buy an EV, when you want a realistic range to compare against a gas car’s insurance cost without committing to a formal quote request for a vehicle you haven’t purchased yet.
- Comparing two or three EV models you’re cross-shopping, since the relative difference between models tends to hold even if the absolute numbers shift once you get real quotes.
- Sanity-checking an actual quote that seems unusually high or low compared to what the factor-based math would suggest, which can flag either an error or an opportunity to ask your insurer specifically what’s driving the difference.
It’s not a substitute for an actual quote once you’re seriously shopping or ready to buy. At that point, get quotes from at least three insurers using your real information, as covered in our full guide to lowering your EV insurance premium, since the gap between a manual estimate and your actual best available rate is exactly the kind of money real shopping around can recover.
The bottom line
You can build a genuinely useful estimate of your EV insurance premium without ever contacting an insurer, by starting from the national baseline, adjusting for your state, your specific vehicle, your age, your driving record, your coverage choices, and your available discounts, in that order. The math won’t be exact, insurers guard their precise formulas for good reason, but it will get you into a realistic range for budgeting and comparison purposes. When you’re ready to actually buy or switch, treat this estimate as a starting point for negotiation and comparison, not a final answer, and get real quotes to find your true number.
This article is for informational purposes only and does not constitute financial or insurance advice. The multipliers and ranges provided are illustrative approximations based on general industry patterns, not a guarantee of your actual rate. Always get a personalized quote from a licensed insurer before making a purchasing decision.